Where does Google find API documentation?

The documentation of popular APIs is spread across many formats, from vendor-curated reference documentation to Stack Overflow threads. For developers, it is often not obvious from where a particular piece of information can be retrieved.

To understand this documentation landscape, Maurício Aniche and I systematically conducted Google searches for the elements of ten popular APIs for a paper that will be presented at WAPI 2018 in June. We queried Google with each API element separately, prefixing each query with the name of the corresponding API (for example, we searched for “Java ArrayList” and “jQuery .add()”). We then retrieved all links from the first page of the search results returned by Google and we determined the domain of each link. The detailed results for each API and each domain are available on GitHub. As an example, for Tensorflow, we found the following domains to play a prominent role:

domain coverage median rank
tensorflow.org 99.7% 1
github.com 88.6% 2
stackoverflow.com 69.6% 4
w3cschool.cn 24.5% 6
keras.io 17.6% 2

We define coverage as the percentage of API elements for which a particular domain appeared on the first page of Google search results, and we define median rank as the median of all ranks of a particular domain when it appeared on the first page of the Google search results.

The following table shows the total number of domains from which search results originated, separately for each API. The numbers demonstrate that API documentation is widely dispersed among many domains: for example, the 5,693 searches for the Java API returned results from 4,139 domains on the first page of search results alone. While there is a strong correlation (Pearson’s r = 0.94) between the size of an API measured in terms of its number of elements (and consequently the number of queries we conducted) and the number of domains, the documentation of some APIs is more dispersed than that of other APIs. Documentation for the 226 classes of JUnit can be found on 252 domains when only considering the first page of Google search results—in other words, there are more domains than API elements in this case. We define the documentation dispersion factor of an API as the number of domains divided by the number of elements, shown in the last column of the following table. While many APIs have a factor in the range between 0.72 and 0.84, JUnit is an outlier with a high factor and Tensorflow, Qt, and Symfony are outliers with a low factor, suggesting that these APIs are documented on a relatively small set of domains. Note that even these APIs still resulted in at least 500 domains.

API elements domains domains/element
JUnit 226 252 1.12
jQuery 296 249 0.84
Guava 399 320 0.80
Android 4,140 3,196 0.77
Java 5,693 4,139 0.73
Hadoop 826 594 0.72
Laravel 675 486 0.72
Symfony 1,700 738 0.43
Qt 1,609 524 0.33
Tensorflow 2,582 583 0.23

Based on this initial data, our next step is to study the documentation of popular APIs in more detail, looking beyond GitHub and Stack Overflow.

All details are available in:

Christoph Treude and Maurício Aniche. Where does Google find API documentation? In WAPI’ 18: Proceedings of the 2nd International Workshop on API Usage and Evolution, 2018. To appear.

This work is in part a replication of our earlier paper from 2011:

Chris Parnin and Christoph Treude. Measuring API Documentation on the Web. In Web2SE ’11: Proceedings of the 2nd International Workshop on Web 2.0 For Software Engineering, pages 25-30, 2011.

Automatically summarising and measuring software development activity

I am delighted to announce that our research on making software developers more productive by unlocking the insights hidden in their repositories will be funded by the Australian Government through the Australian Research Council’s Discovery Early Career Researcher Award (DECRA) scheme. The funding of $361k will allow me to spend 80 per cent of my time on research activities related to the successful proposal for the next three years. Only 197 DECRA grants were awarded this year. Here’s the proposal summary (see our FSE ’15 paper for more details):

This project aims to create technologies for automatically repackaging, interpreting, and aggregating software development activity. The project will devise new natural-language summarisation approaches and productivity metrics that use all data available in a software repository. This is likely to lead to knowledge and tools that allow organisations to quickly integrate new developers into existing software projects, to improve project awareness, and to increase productivity goals. The outcomes would include a comprehensive decision and awareness support system for software projects, based on automating the creation and continual updating of developer activity summaries and measures.

Which NLP library should I choose to analyze software documentation?

MSR17This blog post is based on our MSR 2017 paper.

Software developers author a wide variety of documents in natural language, ranging from commit messages and source code comments to documentation and questions or answers on Stack Overflow. To uncover interesting and actionable information from these natural language documents, many researchers rely on “out-of-the-box” natural language processing (NLP) libraries, often without justifying their choice of a particular library. In a systematic literature review, we identified 33 papers that mentioned the use of an NLP library (55% of which used Stanford’s CoreNLP), but only 2 papers offered a rudimentary justification for choosing a particular library.

Software artifacts written in natural language are different from other natural language documents: Their language is technical and often contains references to code elements that a natural language parser trained on a publication such as the Wall Street Journal will be unfamiliar with. In addition, natural language text written by software developers may not obey all grammatical rules, e.g., API documentation might feature sentences that are grammatically incomplete (e.g., “Returns the next page”) and posts on Stack Overflow might not have been authored by a native speaker.

To investigate the impact of choosing a particular NLP library and to help researchers and industry choose the appropriate library for their work, we conducted a series of experiments in which we applied four NLP libraries (Stanford’s CoreNLP, Google’s SyntaxNet, NLTK, and spaCy) to 400 paragraphs from Stack Overflow, 547 paragraphs from GitHub ReadMe files, and 1,410 paragraphs from the Java API documentation.

Comparing the output of different NLP libraries is not trivial since different overlapping parts of the analysis need to be considered. Let us use the sentence “Returns the C++ variable” as an example to illustrate these challenges. The results of different NLP libraries differ in a number of ways:

  • Tokenization: Even steps that could be considered as relatively straightforward, such as splitting a sentence into its tokens, become challenging when software artifacts are used as input. For example, Stanford’s CoreNLP tokenizes “C++” as “C”, “+”, and “+” while the other libraries treat “C++” as a single token.
  • General part-of-speech tagging (affecting the first two letters of a part-of-speech tag): Stanford’s CoreNLP mis-classifies “Returns” as a noun, while the other libraries correctly classify it as a verb. This difference can be explained by the fact that the example sentence is actually grammatically incomplete—it is missing a noun phrase such as “This method” in the beginning.
  • Specific part-of-speech tagging (affecting all letters of a part-of-speech tag): While several libraries correctly classify “Returns” as a verb, there are slight differences: Google’s SyntaxNet classifies the word as a verb in 3rd person, singular and present tense (VBZ) while spaCy simply tags it as a general verb (VB).

The figure at the beginning of this blog post shows the agreement between the four NLP libraries for the different documentation sources. The libraries agreed on 89 to 94% of the tokens, depending on the documentation source. The general part-of-speech tag was identical for 68 to 76% of the tokens, and the specific part-of-speech tag was identical for 60 to 71% of the tokens. In other words, the libraries disagreed on about one of every three part-of-speech tags—strongly suggesting that the choice of NLP library has a large impact on any result.

To investigate which of the libraries achieves the best result, we manually annotated a sample of sentences from each source (a total of 1,116 tokens) with the correct token splitting and part-of-speech tags, and compared the results of each library with this gold standard. We found that spaCy had the best performance on software artifacts from Stack Overflow and the Java API documentation while Google’s SyntaxNet worked best on text from GitHub. The best performance was reached by spaCy on text from Stack Overflow (90% of the part-of-speech tags correct) while the worst performance came from SyntaxNet when we applied it to natural language text from the Java API Documentation (75% of the part-of-speech tags correct). Detailed results and examples of disagreements between the gold standard and the four NLP libraries are available in our MSR 2017 paper.

This work raises two main issues. The first one is that many researchers apply NLP libraries to software artifacts written in natural language, but without justifying the choice of the particular NLP library they use. In our work, we were able to show that the output of different libraries is not identical, and that the choice of an NLP library matters when they are applied to software engineering artifacts written in natural language. In addition, in most cases, the commonly used Stanford CoreNLP library was outperformed by other libraries, and spaCy—which provided the best overall experience—was not mentioned in any recent software engineering paper that we included in our literature review.

The second issue is that the choice of the best NLP library depends on the task and the source: For all three sources, NLTK achieved the highest agreement with our manual annotation in terms of tokenization. On the other hand, if the goal is accurate part-of-speech tagging, NLTK actually yielded the worst results among the four libraries for Stack Overflow and GitHub data. In other words, the best choice of an NLP library depends on which part of the NLP pipeline is going to be employed. In addition, while spaCy outperformed its competition on Stack Overflow and Java API documentation data, Google’s SyntaxNet showed better performance for GitHub ReadMe files.

The worst results were generally observed when analyzing Java API documentation, which confirms our initial assumption that the presence of code elements makes it particularly challenging for NLP libraries to analyze software artifacts written in natural language. In comparison, the NLP libraries were less impacted by the often informal language used in GitHub ReadMe files and on Stack Overflow. Going forward, the main challenge for researchers interested in improving the performance of NLP libraries on software artifacts will be the effective treatment of code elements. We expect that the best possible results will eventually be achieved by models trained specifically on natural language artifacts produced by software developers.

Improving Access to Software Documentation — Two ICSE 2016 papers

This is a cross-post from the University of Adelaide’s CREST blog

Software development is knowledge-intensive, and the effective management and exchange of knowledge is key in every software project. While much of the information needed by software developers is captured in some form of documentation, it is often not obvious where a particular piece of information is stored. Different documentation formats, such as wikis or blogs, contain different kinds of information, written by different individuals and intended for different purposes. Navigating this documentation landscape is particularly challenging for newcomers.

In collaboration with researchers from Canada and Brazil, we are envisioning, developing and evaluating tool support around software documentation for different stakeholders. Two of these efforts will be presented at the International Conference on Software Engineering — the premier conference in software engineering — this year.

In the first project in collaboration with Martin Robillard from McGill University in Canada, we developed an approach to automatically augment API documentation with “insight sentences” from Stack Overflow — sentences that are related to a particular API type and that provide insight not contained in the API documentation of that type. The preprint of the corresponding paper is available here.

SISE.png

Abstract:

Software developers need access to different kinds of information which is often dispersed among different documentation sources, such as API documentation or Stack Overflow. We present an approach to automatically augment API documentation with “insight sentences” from Stack Overflow — sentences that are related to a particular API type and that provide insight not contained in the API documentation of that type. Based on a development set of 1,574 sentences, we compare the performance of two state-of-the-art summarization techniques as well as a pattern-based approach for insight sentence extraction. We then present SISE, a novel machine learning based approach that uses as features the sentences themselves, their formatting, their question, their answer, and their authors as well as part-of-speech tags and the similarity of a sentence to the corresponding API documentation. With SISE, we were able to achieve a precision of 0.64 and a coverage of 0.7 on the development set. In a comparative study with eight software developers, we found that SISE resulted in the highest number of sentences that were considered to add useful information not found in the API documentation. These results indicate that taking into account the meta data available on Stack Overflow as well as part-of-speech tags can significantly improve unsupervised extraction approaches when applied to Stack Overflow data.

The second project was developed in collaboration with three Brazilian researchers: Igor Steinmacher from the Federal University of Technology — Paraná, Tayana Conte from the Federal University of Amazonas, and Marco Gerosa from the University of São Paulo. We developed and evaluated FLOSScoach, a portal to support project newcomers, which we found to be effective at lowering project entry barriers. The preprint of the corresponding paper is available here and FLOSScoach is available here.

FLOSScoach.png

Abstract:

Community-based Open Source Software (OSS) projects are usually self-organized and dynamic, receiving contributions from distributed volunteers. Newcomers are important to the survival, long-term success, and continuity of these communities. However, newcomers face many barriers when making their first contribution to an OSS project, leading in many cases to dropouts. Therefore, a major challenge for OSS projects is to provide ways to support newcomers during their first contribution. In this paper, we propose and evaluate FLOSScoach, a portal created to support newcomers to OSS projects. FLOSScoach was designed based on a conceptual model of barriers created in our previous work. To evaluate the portal, we conducted a study with 65 students, relying on qualitative data from diaries, self-efficacy questionnaires, and the Technology Acceptance Model. The results indicate that FLOSScoach played an important role in guiding newcomers and in lowering barriers related to the orientation and contribution process, whereas it was not effective in lowering technical barriers. We also found that FLOSScoach is useful, easy to use, and increased newcomers’ confidence to contribute. Our results can help project maintainers on deciding the points that need more attention in order to help OSS project newcomers overcome entry barriers.

Research study: Developers want to know about unusual events and think their input/output is impossible to measure

developmentactivitySoftware developers pursue a wide range of activities as part of their work, and making sense of what they did in a given time frame is far from trivial as evidenced by the large number of awareness and coordination tools developed in recent years. To inform tool design for making sense of the information available about a developer’s activity, my colleagues Fernando Figueira Filho, Uirá Kulesza and I sent a questionnaire to 2000 randomly selected GitHub users (156 responses) to investigate what information developers would expect in a summary of development activity, how they would measure development activity, and what factors influence how such activity can be condensed into textual summaries or numbers. The questionnaire contained questions such as

“Assume it’s Monday morning and you have just returned from a week-long vacation. One of your colleagues is giving you an update on their development activities last week. What information would you expect to be included in their summary?”

and

“How would you design metrics to automatically measure the input/output of a software developer in a given month? Why?”

Here are the eight most important findings (for a more detailed account, read our ESEC/FSE 2015 paper [preprint]):

1. Developers want to know about unusual events

In addition to status updates on projects, tasks and features, many developers mentioned the importance of being aware of unusual events. One developer described the ideal summary of development activity as follows:

“Work log, what functionality [has] been implemented/tested. What were the challenges. Anything out of the ordinary.”

This anything-out-of-the-ordinary theme came up many times in our study:

“We cut our developer status meetings way down, and started stand up meetings focusing on problems and new findings rather than dead boring status. Only important point is when something is not on track, going faster than expected and why.”

When we asked about what unusual events they wanted to be kept aware of, the developers described several examples:

“If a developer hasn’t committed anything in a while, his first commit after a long silence could be particularly interesting, for example, because it took him a long time to fix a bug. Also, important commits might have unusual commit messages, for example including smileys, lots of exclamation marks or something like that. Basically something indicating that the developer was emotional about that particular commit.”

Another developer added:

“Changes to files that haven’t been changed in a long time or changes to a large number of files, a large number of deletions.”

Based on this feedback, we have started working on tool support for detecting unusual events in software projects. A first prototype for the detection of unusual commits is available online [demosource codepaper]. We are in the process of expanding this work to detect unusual events related to issues, pull requests, and other artifacts.

2. Developers with more experience see less value in using method names or code comments in summaries of development activity

In the questionnaire, we asked about a few sources that could potentially be used to generate a summary automatically. The titles of issue (opened and closed) received the highest rating, while method names and code comments received the lowest. When we divided developers based on their experience, the more experienced ones (six or more years) ranked method names and code comments as significantly less important compared to less experienced developers. We hypothesize that these differences can be explained by the diversity of activities performed by more experienced developers. While junior developers might only work on well-defined tasks involving few artifacts, the diversity of the work carried out by senior developers makes it more difficult to summarize their work by simply considering method names, code comments, or issue titles.

3. C developers see more value in using code comments in summaries of development activity compared to other developers

Another statistically significant difference occurred when we divided developers based on the programming languages they use on GitHub. Developers using C rated the importance of code comments in summaries significantly higher than developers who do not use C. We hypothesize that this might be related to the projects developers undertake in different languages. C might be used for more complex tasks which requires more meaningful code comments. No other programming language resulted in statistically significant differences.

4. Many developers believe that their input/output (i.e., productivity) is impossible to measure

When we asked developers to design a metric for their input/output, many of them told us that it’s impossible to measure:

“It’s difficult to measure output. Simple quantitative measures like lines of code don’t convey the difficulty of a code task. Changing the architecture or doing a conceptual refactoring may have significant impact but very little evidence on the code base.”

While some developers mentioned potential metrics such as LOC, the overall consensus was that no metric is good enough:

“Anything objective, like lines of code written, hours logged, tags completed, bugs squashed, none of them can be judged outside of the context of the work being done and deciphering the appropriate context is something that automated systems are, not surprisingly, not very good at.”

One of the main reasons for not measuring developer input/output is that metrics can be gamed:

“Automatic is pretty challenging here, as developers are the most capable people on earth to game any system you create.”

And many metrics do not reflect quality either:

“A poor quality developer may be able to close more tickets than anyone else but a high quality developer often closes fewer tickets but of those few, almost none get reopened or result in regressions. For these reasons, metrics should seek to track quality as much as they track quantity.”

5. Developers with more experience see less value in measuring input/output with LOC, bugs fixed, and complexity

We asked about several potential measures in the questionnaire, including lines of code (LOC), number of bugs fixed, and complexity. Developers with at least six years experience rated all of these measures as significantly less suitable for measuring input/output compared to developers with up to five years of experience.

6. Web developers see more value in measuring the number of bugs introduced compared to other developers

Developers who use JavaScript and CSS found the metric of “few bugs introduced” significantly more suitable compared to developers who do not use those languages. We hypothesize that it is particularly difficult to recover from bugs in web development.

7. C developers see LOC and complexity as more suitable measures for development activity compared to other developers

On the other hand, the measures of LOC and complexity were seen as significantly more suitable by developers using C compared to those who don’t use C (on GitHub, at least). We hypothesize that this difference is due to complex programs often being written in C.

8. Developers think textual summaries of development activity could be useful, possibly augmented with numbers

Developers who talked about the difficulty of measuring development activity generally felt positive about the idea of summarizing development activity:

“It’s dangerous to measure some number & have rankings. Because that can be easily gamed. I think having summaries of what everyone did is helpful. But ranking it & assessing it is very difficult/could encourage bad habits. I think it’s better to provide the information & leave it up to the reader to interpret the level of output.”

Numbers might be used to complement text, but not the other way around:

“I think that’s probably the better approach: text first, and maybe add numbers. […] I spend about 45 minutes every Friday reviewing git diffs, just to have a clearer picture in my mind of what happened over the week. […] The automatic summary would make it harder to miss something, and easier to digest.”

Next steps & follow-up survey

In addition to testing the various hypotheses mentioned above, we are now in the process of designing and building the tool support that the developers in our study envisioned: A development activity summarizer that reflects usual and unusual events, supported by numbers that are intended to augment the summaries instead of pitting developers against each other. Please leave a comment below if you’re interested in this work, and consider filling out our follow-up survey on summarizing GitHub data.

TaskNav: Extracting Development Tasks to Navigate Software Documentation

While much of the knowledge needed to develop software is captured in some form of documentation, there is often a gap between the information needs of software developers and the structure of this documentation. Any kind of hierarchical structure with sections and subsections can only enable effective navigation if the section headers are adequate cues for the information needs of developers.

To help developers navigate documentation, during my PostDoc with Martin Robillard at McGill University, we developed a technique for automatically extracting task descriptions from software documentation. Our tool, called TaskNav, suggests these task descriptions in an auto-complete search interface for software documentation along with concepts, code elements, and section headers.

We use natural language processing (NLP) techniques to detect every passage in a documentation corpus that describes how to accomplish some task. The core of the task extraction process is the use of grammatical dependencies identified by the Stanford NLP parser to detect every instance of a programming action described in a documentation corpus. Different dependencies are used to account for different grammatical structures (e.g., “returning an iterator”, “return iterator”, “iterator returned”, and “iterator is returned”):


In the easiest case, a task is indicated by a direct object relationship, as in the example shown above. TaskNav uses this information to extract two tasks descriptions from the example sentence: “generate receipt” and “generate other information”.


When passive voice is used, the passive nominal subject dependency connects the action and the object. In this case, TaskNav finds the task “set thumbnail size in templates”.

Some actions do not have a direct object. In those cases, TaskNav follows the preposition dependency and would extract the task “integrate with Google Checkout” from the example sentence above.

Once the TaskNav user runs a search query after selecting the search terms from auto-complete, search results are presented in a sidebar. When the user selects a result, the corresponding document is opened in TaskNav. The paragraph that matched the query is highlighted, and the document is automatically scrolled to that paragraph.

We conducted a field study in which six professional developers used TaskNav for two weeks as part of their ongoing work. We found search results identified through extracted tasks to be more helpful to developers than those found through concepts, code elements, and section headers.

TaskNav can automatically analyze and index any documentation corpus based on a starting URL and some configuration parameters, such as which HTML tags should be ignored. Documentation users can benefit from TaskNav by taking advantage of the task-based navigation offered by the auto-complete search interface. For documentation writers, TaskNav provides analytics that show how documentation is used (e.g., top queries, most frequently read documents, and unsuccessful searches). Researchers can benefit from the data accumulated by TaskNav’s logging mechanism as it provides detailed data on how software developers search and use software documentation.

All the details of our work on TaskNav are now available as a journal paper in IEEE Transactions on Software Engineering [link] [preprint], and TaskNav will also appear as a Demo at ICSE 2015.

Try TaskNav now!

WorkItemExplorer: Visualizing Software Development Tasks Using an Interactive Exploration Environment

In recent years, the focus of tool support for software developers has shifted from source code alone towards tools that incorporate the entire software development process. On top of source code editing and compilation, many development platforms, such as IBM’s Jazz or Microsoft’s Visual Studio, now offer explicit support for the management of development tasks.

These tasks have become important cogs in collaborative software development processes, and in a typical software project, developers as well as managers need to maintain an awareness of an abundance of tasks along with their properties and relationships. Current tools that aim at providing an understanding of the state of a task management system (e.g., developer dashboards) have several shortcomings, such as limited interactivity and insufficient visualizations. To better support developers and managers in their understanding of all aspects of their software development tasks, Patrick, Lars, Peggy, and I have developed WorkItemExplorer, an interactive visualization environment for the dynamic exploration of data gathered from a task management system.

WorkItemExplorer leverages multiple coordinated views by allowing users to have multiple different views, such as bar charts or time lines, open at the same time, all displaying the same data in different ways. The coordination comes into play when interacting with the views; highlighting one data element will have a mirrored effect on all other views. This enables the exploration of data relationships as well as the discovery of trends that might otherwise be difficult to see because they span multiple aspects. WorkItemExplorer is a web-based tool built on top of the Choosel framework. We have implemented an adapter for queries against the work item component of IBM’s Jazz platform, and we are working on integrating other task management systems.

WorkItemExplorer currently supports seven data elements and the relationships between them: work items, developers, iterations, project areas, team areas, tags, and comments. Using a drag-and-drop interface, these data elements can be moved into seven different views:

  • A text view with different grouping options (e.g., to see a list of work items grouped by their owner).
  • A tag cloud, primarily for the exploration of work item tags.
  • A graph for the exploration of relationships between different kinds of artifacts, such as work items and iterations.
  • A bar chart to visualize data with different groupings using bars of different lengths (e.g., to visualize developers by the number of work items they own).
  • A pie chart to visualize data with different groupings using pie wedges of different sizes (e.g., to show work items by priority).
  • A heat bars view to visualize work items over time, with an additional grouping option (e.g., to visualize the creation of different work item types, such as defects and enhancements, over time).
  • A time line to analyse data over time. Different time properties, such as creation or modification date, can be chosen (e.g., to visualize team area creation over time).

The video above shows an example use case for WorkItemExplorer by exploring who is working on “important” work items at the moment. The task “importance” can be defined in many different ways, and an exploratory tool, such as WorkItemExplorer, can be used to understand the implications of different approaches. To explore important work items and their owners, we open up two bar charts, and then drag all of the work items onto both of them. We then group one bar chart by priority, and the other one by severity, and we drag the bars that we are interested in into a third view, such as a text view. Here, we drag the bars corresponding to high priority and major as well as critical severity. If we now group the text view by work item owner, we get a list of all people working on important work items, and we can continue to explore their workload in more detail. In addition, this configuration allows us to immediately explore the relationship between severity and priority of work items in our data set. When mousing over major severity in the bar chart on the right, through partial highlighting, we can see how work items with major severity are distributed across the different priorities in the bar chart on the left.

Our preliminary evaluation of WorkItemExplorer will be published at ICSE 2012 in Zurich, Switzerland (paper pre-print). We found that

  • WorkItemExplorer can answer questions that developers ask about task management systems,
  • WorkItemExplorer enables the acquisition of new insights through the free exploration of data, and
  • WorkItemExplorer offers a flexible environment in which different individuals solve the same task in different ways.

(© 2012 IEEE. Personal use of this material is permitted. Permission from IEEE must be obtained for all other uses, in any current or future media, including reprinting/republishing this material for advertising or promotional purposes, creating new collective works, for resale or redistribution to servers or lists, or reuse of any copyrighted component of this work in other works.)

Programming in a Socially Networked World: the Evolution of the Social Programmer

Since I first blogged about Stack Overflow in February 2011, the number of questions on the Q&A portal has more than doubled (from 1 million to almost 2.5 million), as has the number of answers (from 2.5 million to 5.2 million). According to a recent study by Lena Mamykina and colleagues, over 92% of the questions on Stack Overflow are answered — in a median time of a staggering 11 minutes.

The virtually real-time access to a community of other programmers willing and eager to help is an almost irresistible resource, as shown by the 12 million visitors and 131 million page views in December 2011 alone. Also, as we found in a recent study  for Web2SE 2011, Stack Overflow can reach high levels of coverage for a given topic. For example, we analyzed the Google search results for one particular API –- jQuery -– and found at least one Stack Overflow question on the first page of the search results for 84% of the API’s methods.

The access to such a vast repository of knowledge that is just a web search away raises several research questions:

  • Will developers who focus on reusing content from the web have sufficient understanding of the inner workings of the software they produce?
  • Are web resources going to cover all important aspects of a topic?
  • What meta-data is needed to facilitate technical information-seeking?
  • How can we address security and copyright concerns that come with using other developers’ code?

In a recent position paper, Fernando, Brendan, Peggy and I discuss the past, present, and future of software developers that have access to an unprecedented amount and diversity of resources on the web. The paper is available as a pre-print, and will be presented at the Future of Collaborative Software Development workshop co-located with CSCW 2012 in Seattle in February.

This is the abstract of the paper:

Social media has changed how software developers collaborate, how they coordinate their work, and where they find information. Social media sites, such as the Question and Answer (Q&A) portal Stack Overflow, fill archives with millions of entries that contribute to what we know about software development, covering a wide range of topics. For today’s software developers, reusable code snippets, introductory usage examples, and pertinent libraries are often just a web search away. In this position paper, we discuss the opportunities and challenges for software developers that rely on web content curated by the crowd, and we envision the future of an industry where individual developers benefit from and contribute to a body of knowledge maintained by the crowd using social media.

On using grounded theory in software engineering research

In this blog post, I reflect on my experiences from conducting a grounded theory study as a software engineering researcher in summer 2010. In the study, Peggy and I examined the role of a community portal, such as IBM’s Jazz or Microsoft’s MSDN, in the process of communicating software development knowledge. We just presented the results of the study at ESEC/FSE in September 2011 (paper pre-print). This is far from the first blog post on experiences using grounded theory. To read about other researchers’ experiences, you might want to take a look at L. Lennie Irvin’s collection of blog posts on grounded theory or the 2008 CASCON paper by Steve Adolph from UBC.

The Corbin / Strauss approach

Grounded theory is a systematic methodology to generate theory from data. The methodology originates from the Social Sciences and aims at studying social phenomena. There are different stances on how grounded theory should be carried out, most notably the positivist approach described by Anselm Strauss, and the more interpretative view that is for example described by Kathy Charmaz.

In our study, we followed the grounded theory approach as described by Juliet Corbin and Anselm Strauss in the Qualitative Sociology journal. They specify eleven procedures and canons that grounded theory researchers as well as the readers and evaluators of grounded theory studies should be familiar with:

  1. Data collection and analysis are interrelated processes. When grounded theory is used, data analysis begins as soon as the first bit of data is collected.
  2. Concepts are the basic units of analysis. Incidents from various data sources (in our case: interview transcripts, documentation artifacts, and ethnographic field notes) are given “conceptual labels”. The focus is on concepts that “earn their way into the theory by being present repeatedly”.
  3. Categories must be developed and related. Categories are more abstract than labels and can explain relationships between concepts. A category must be developed in terms of its properties, dimensions, conditions and consequences.
  4. Sampling in grounded theory proceeds on theoretical grounds. Sampling in grounded theory focuses on “incidents, events and happenings” (in our case: all incidents that were related to the creation or use of artifacts posted on a community portal).
  5. Analysis makes use of constant comparisons. When a new incident is noted, it has to be compared against other incidents for similarities and differences.
  6. Patterns and variations must be accounted for. Data must be examined for regularity as well as for irregularities.
  7. Process must be built into the theory. Grounded theory is about understanding processes.
  8. Writing theoretical memos is an integral part of doing grounded theory. To make sure that no concepts or categories are forgotten, memos have to be written throughout the course of the study.
  9. Hypotheses about relationships among categories should be developed and verified as much as possible during the research process. Hypotheses are constantly revised until they hold true for all of the evidence gathered in the study.
  10. A grounded theorist need not work alone. Concepts, categories and their relationships must be tested with other researchers.
  11. Broader structural conditions must be analyzed, however microscopic the research. A grounded theory study should specify how the microscopic perspective links with broader conditions (in our case: how does the particular community portal in our study compare to other portals?).

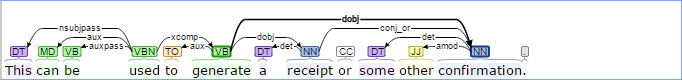
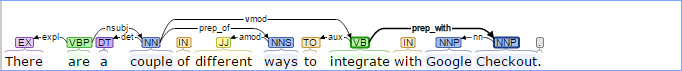
In grounded theory, coding is the fundamental process that researchers use to make sense of their data. Coding is done in three steps:

  • Open: Data is annotated line by line (see picture above for an example from our study) and concepts are created when they are present repeatedly. Open coding is applied to all data collected (in our case: interview transcripts, documentation artifacts, and ethnographic field notes). Based on the concepts, more abstract categories are developed and related. Each category has properties, dimensions, conditions, and consequences.
  • Axial: Data is put together in new ways by making explicit connections between categories and sub-categories.
  • Selective: The core category is identified and systematically related to other categories.

Making grounded theory explicit

For qualitative researchers, many of the guidelines described by Corbin and Strauss are nothing new, and in fact, we found that we had implicitly followed several of them already in previous studies. For example, when conducting interviews, researchers tend to revise their questions in later interviews based on the answers given in the first interviews and data collection is rarely completely separate from data analysis. However, there was a lot of benefit in making this process explicit:

  • We didn’t have to plan out every detail of our study beforehand.  This is often a challenge in exploratory field research where researchers are not aware of all peculiarities of the setting they are about to conduct a study in. When using grounded theory, it is “officially” part of the research methodology that questions are refined over time, that not all interviewees are pre-determined, and that the resulting theme is unknown beforehand.
  • Similarly, we were able to change direction during the study when we found interesting themes to follow-up on. Again, this is something that frequently happens in qualitative research, but grounded theory makes it explicit.
  • Grounded theory focuses on concepts that become part of the theory because they are present in the data more than once. This makes it easier for researchers to focus on themes that are relevant in the study context rather than themes that only matter to the researcher.
  • Especially during open coding, the use of grounded theory helps ignore pre-conceptions of how and why certain incidents occur. Going through interview scripts or ethnographic field notes on a line by line basis forces researchers to think about every aspect of the data collected.
  • Grounded theory also allows researchers to consider everything they encounter during a study, such as anecdotes or water-cooler conversations. This is not possible with a pre-defined set of interviewees or data sources.

The emergence of the core category

Going into the grounded theory study, I was concerned that after all the open and axial coding, there would be no “core category” that emerged from the data, and in fact, it seems a bit like magic the way that it is conventionally described: “Sufficient coding will eventually lead to a clear perception of which category or conceptual label integrates the entire analysis.”

At least from our experience, I can say that we did encounter a core category that came out pretty clear at the end of the selective coding. One of the challenges is to abstract the core category to the right level. For example, in our case, we found several interesting differences between artifacts on a community portal such as blog posts, wiki pages, and technical articles. While not a single of these differences stood out, we identified the fact that artifacts are different along several dimensions as core category.

The role of research questions

We found the role of research questions tricky when using grounded theory as methodology. As Corbin and Strauss describe it, “each investigator enters the field with some questions or areas for observation, or will soon generate them. Data will be collected on these matters throughout the research endeavor, unless the questions prove, during analysis, to be irrelevant.”

Researchers have questions going into a study, but these questions are refined, changed, and altered throughout the study. This presents a challenge when reporting the research questions for a study. To be thorough, one would have to report the initial questions along with their iterations over the course of the study. As research papers aim at the dissemination of research results rather than a discussion of the research process itself, we found it more useful to report the final set of questions.

Lack of tool support

Coding of ethnographic field notes, interview transcripts and software artifacts is tedious. Several researchers have developed tools to help with that process, in particular by offering traceability between data and codes. Examples of such tools include Saturate, Qualyzer, Atlas, MaxQDA and WeftQDA.

Unfortunately, I found that with all these tools, attaching codes to data and relating codes to each other is hard to do on a computer. After trying several tools (after all, as a Computer Science student I’d like to believe that computers can solve complex editing and annotation tasks), I gave up, printed all the data in font size 8, and went back to using pen and paper. While the traceability is only achieved by following hand-written annotations, it felt a lot more natural to annotate data “by hand”. We need a metaphor better than a list of file names to support our cognition when several sheets of paper are involved.

Reporting a grounded theory study

It is challenging to write a paper describing a qualitative study, even when there is no grounded theory involved. Reporting the qualitative coding in sufficient detail so that other researchers can replicate the work would require giving all the instances of a code being applied to an artifact in a 10-page paper. In approaches such as grounded theory, the problem gets worse as codes would have to be considered at different levels of detail (i.e., open coding, axial coding, selective coding). Instead of including all these details in their papers, some researchers choose to host the details online. That is not possible in all research settings though. For example, researchers who have access to proprietary data are usually not allowed to make their data available online.

To provide at least some traceability to readers and reviewers, we assigned unique identifiers to each one of our interviewees and we also indicated the role of the interviewees in the identifier to add additional context without revealing confidential information (e.g., M1 for the first manager we interviewed, and D1 for the first developer). When quoting individuals in our paper, we referred to the interviewees using these identifiers. The right amount of quotes in a qualitative research paper is a question of style. Some researchers prefer many exemplary quotes to make the research more concrete, others prefer generalizations and therefore discourage the use of concrete quotes. We found it easier to tell the story in a paper using quotes — however, it is important to understand that these quotes are only meant to represent a much larger body of qualitative data.

In summary

Grounded theory is a great methodology to understand the “how” and “why” of a research problem. Making the coding process explicit and going through data on a line by line basis allows for new insights, and also ensures that no important themes are overlooked. While the coding and the reporting of results can be tedious, grounded theory should be in the toolbox of every researcher who tries to understand processes in software development and beyond.

PS – Thanks to Fernando Figueira Filho for proof-reading a draft version of this post!

An Exploratory Study of Software Reverse Engineering in a Security Context

Software reverse engineering—the process of analysing a system to identify its components and to create representations of the system in other forms or at higher levels of abstraction—is a challenging task. It becomes even more challenging in security contexts such as the detection of malware or the decryption of encrypted file systems. In such settings, web resources are often unavailable because work has to be performed offline, files can rarely be shared in order to avoid infecting co-workers with malware or because information is classified, time pressure is immense, and tool support is limited.

To gain insights into the work done by security reverse engineers, Peggy, Fernando Figueira Filho, Martin Salois from DRDC Valcartier and I conducted an exploratory study aimed at understanding their processes, tools, artifacts, challenges, and needs. The results of this study will be presented at WCRE 2011 in Limerick, Ireland, in October.

We identified five processes that are part of reverse engineering in a security context:

  • analyzing assembly code,
  • documenting findings through different kinds of artifacts,
  • transferring knowledge to other reverse engineers,
  • articulating work, and
  • reporting of findings to stakeholders.

There is no general process that can capture all of the work done by security reverse engineers. Task complexity, security context, time pressure, and tool constraints make it impossible to follow a structured heavyweight process. Therefore, process and tool support has to be lightweight and flexible.

In our future work, we hope to address the challenges with improved tools and processes, and to study their usefulness in the unique work environment of security reverse engineers.

A pre-print of the paper is available here
(© 2011 IEEE. Personal use of this material is permitted. Permission from IEEE must be obtained for all other uses, in any current or future media, including reprinting/republishing this material for advertising or promotional purposes, creating new collective works, for resale or redistribution to servers or lists, or reuse of any copyrighted component of this work in other works.)

This is the abstract of the paper:

Illegal cyberspace activities are increasing rapidly and many software engineers are using reverse engineering methods to respond to attacks. The security-sensitive nature of these tasks, such as the understanding of malware or the decryption of encrypted content, brings unique challenges to reverse engineering: work has to be done offline, files can rarely be shared, time pressure is immense, and there is a lack of tool and process support for capturing and sharing the knowledge obtained while trying to understand plain assembly code. To help us gain an understanding of this reverse engineering work, we report on an exploratory study done in a security context at a research and development government organization to explore their work processes, tools, and artifacts. In this paper, we identify challenges, such as the management and navigation of a myriad of artifacts, and we conclude by offering suggestions for tool and process improvements.